Stimulus 5: Wavin’ Flag by Young Artists For Haiti
Posted: November 13, 2017 Filed under: Cross-listening analysis, Stimulus-wise Analysis | Tags: Continuous emotion ratings, Finger temperature, Heartrate, Respiration rate, Skin conductance, Stimulus 5, surface Electromyography, Wavin' Flag, Young Artists For Haiti Leave a commentThese graphs report per stimulus the time course of responses across the 24 listening sessions. Some report the general patterns of responses, other show how the listener’s responses changed over successive exposures
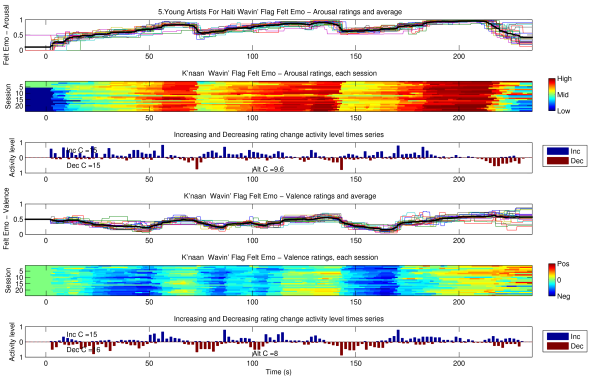
The continuous ratings of Felt Emotional Valence and Arousal, plotted three different ways. First as individual lines with the cross listening average, then layered per session with colour marking the scale values, and finally the activity-level times series reporting the proportion of listenings showing rating changes up or down per 2 s interval.
These responses were collected Wavin’ Flag, a song by K’naan and performed by a large collection of Canadian pop musicians as a fundraiser for Haiti after the earthquake of 2010. It was included because the music made the listener cry the first time they heard it on the radio, around the time of the earthquake. The following video is close but not exactly the radio cut used in the experiment.
Stimulus 4: The Littlest Birds by The Be Good Tanyas
Posted: November 13, 2017 Filed under: Cross-listening analysis, Stimulus-wise Analysis | Tags: Continuous emotion ratings, Finger temperature, Heartrate, Respiration rate, Skin conductance, Stimulus 4, surface Electromyography, The Be Good Tanyas, The Littlest Birds Leave a commentThese graphs report per stimulus the time course of responses across the 24 listening sessions. Some report the general patterns of responses, other show how the listener’s responses changed over successive exposures
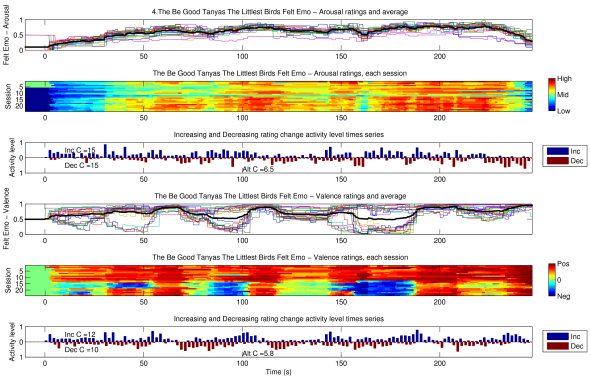
The continuous ratings of Felt Emotional Valence and Arousal, plotted three different ways. First as individual lines with the cross listening average, then layered per session with colour marking the scale values, and finally the activity-level times series reporting the proportion of listenings showing rating changes up or down per 2 s interval.
These responses were collected The Littlest Birds, a bluegrass tune by The Be Good Tanyas. This song and all the harmonies were very familiar to the listener. It’s an extremely effective earworm.
Stimulus 3: Visiting Hours by Shane Koyczan
Posted: November 13, 2017 Filed under: Cross-listening analysis, Stimulus-wise Analysis, Uncategorized | Tags: Continuous emotion ratings, Finger temperature, Heartrate, Respiration rate, Shane Koyczan, Skin conductance, Stimulus 3, surface Electromyography, Visiting Hours Leave a commentThese graphs report per stimulus the time course of responses across the 24 listening sessions. Some report the general patterns of responses, other show how the listener’s responses changed over successive exposures
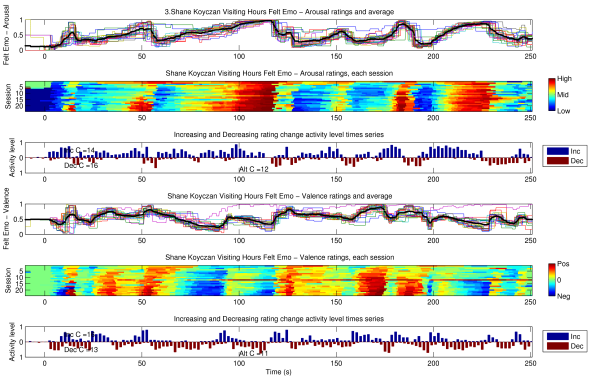
The continuous ratings of Felt Emotional Valence and Arousal, plotted three different ways. First as individual lines with the cross listening average, then layered per session with colour marking the scale values, and finally the activity-level times series reporting the proportion of listenings showing rating changes up or down per 2 s interval.
These responses were collected Visiting Hours, a studio recording of spoken word poetry by Shane Koyczan. The recording had been in the listener’s library for a few years, but it was not regularily heard. The following is a different performance of the same piece.
Stimulus 2: Bizness by tUnE-yArDs
Posted: November 13, 2017 Filed under: Cross-listening analysis, Stimulus-wise Analysis | Tags: Bizness, Continuous emotion ratings, Finger temperature, Heart rate, Respiration rate, Skin conductance, Stimulus 2, surface Electromyography, tUnE-yArDs Leave a commentThese graphs report per stimulus the time course of responses across the 24 listening sessions. Some report the general patterns of responses, other show how the listener’s responses changed over successive exposures
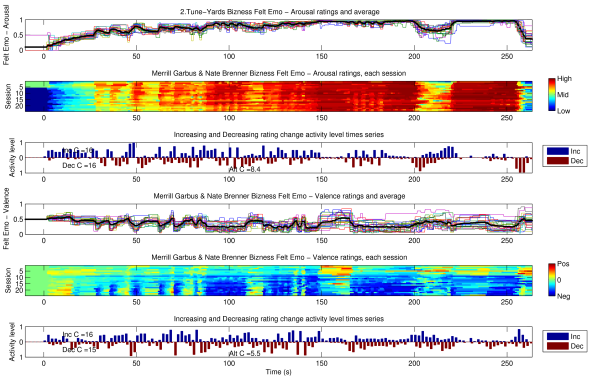
The continuous ratings of Felt Emotional Valence and Arousal, plotted three different ways. First as individual lines with the cross listening average, then layered per session with colour marking the scale values, and finally the activity-level times series reporting the proportion of listenings showing rating changes up or down per 2 s interval.
The music these responses were collected to was Tune-Yards’s Bizness, from the Whokill album. The listener was familiar with this piece and album when they started the experiment.
Stimulus 1: Varúò by Sigur Rós
Posted: November 13, 2017 Filed under: Cross-listening analysis, Stimulus-wise Analysis | Tags: Continuous emotion ratings, Finger temperature, Heartrate, Respiration rate, Sigur Ros, Skin conductance, Stimulus 1, surface Electromyography, Varuo Leave a commentThese graphs report per stimulus the time course of responses across the 24 listening sessions. Some report the general patterns of responses, other show how the listener’s responses changed over successive exposures
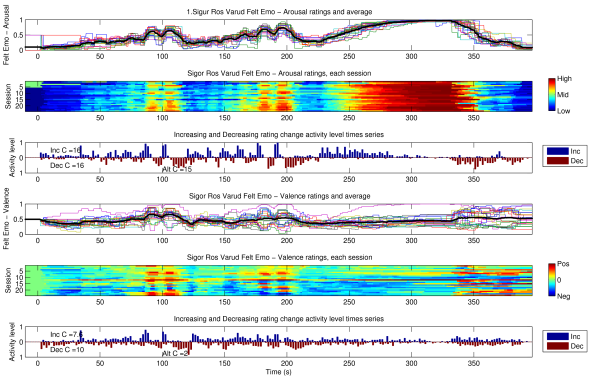
The continuous ratings of Felt Emotional Valence and Arousal, plotted three different ways. First as individual lines with the cross listening average, then layered per session with colour marking the scale values, and finally the activity-level times series reporting the proportion of listenings showing rating changes up or down per 2 s interval.
The music these responses were collected to was Sigur Ros’s Varuo, from the Valtari album, release in 2011. These responses are of the listeners first 24 hearings of this particular piece of epic post-rock.
