Stimulus 1: Varúò by Sigur Rós
Posted: November 13, 2017 Filed under: Cross-listening analysis, Stimulus-wise Analysis | Tags: Continuous emotion ratings, Finger temperature, Heartrate, Respiration rate, Sigur Ros, Skin conductance, Stimulus 1, surface Electromyography, Varuo Leave a commentThese graphs report per stimulus the time course of responses across the 24 listening sessions. Some report the general patterns of responses, other show how the listener’s responses changed over successive exposures
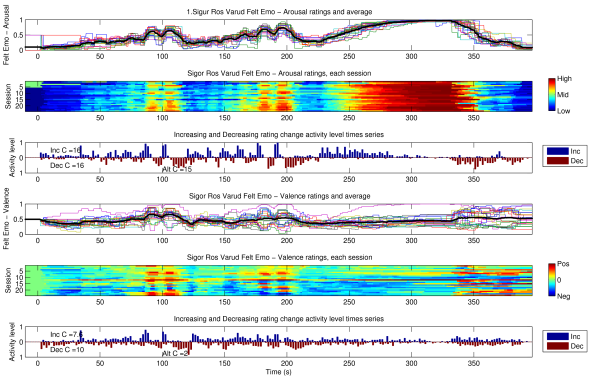
The continuous ratings of Felt Emotional Valence and Arousal, plotted three different ways. First as individual lines with the cross listening average, then layered per session with colour marking the scale values, and finally the activity-level times series reporting the proportion of listenings showing rating changes up or down per 2 s interval.
The music these responses were collected to was Sigur Ros’s Varuo, from the Valtari album, release in 2011. These responses are of the listeners first 24 hearings of this particular piece of epic post-rock.
Expressive EMG activity to stim 1: Sigur Ros’s Varuo
Posted: November 8, 2013 Filed under: Uncategorized | Tags: EMG, EMG graph, Emotion, Expression, Individual listenings, Intensity, Plot explanation, Sigur Ros, Stimulus 1, Sublime face, Valence, Yawning Leave a commentOne clue as to how we feel while listening to music is in how we move, from dance-like motions to brows furrowed in concentration. Surface electromyography sensors (sEMG) are very useful in picking up muscle contractions which generate these expressive behaviours. In the solo response project, two typical sensors on the face to capture brow furrowing and smiling (see the set-up post) and an additional sensor tracking contractions of the trapezius muscle up the back of my neck, to capture tension in the back and head nodding. While there is much to say about each signal, this post is about what these sensors measured of my responses to Varuo, by Sigur Ros.

sEMG activity of the Corrugator Supercilious, Zygomaticus, and Trapezius through the 24 listenings of Sigor Ros’ Varuo. Session X Time heat plots and normalised activity-levels per signal.
In the analysis post, I mentioned that the B section, starting around 220s, was really intense, and often overwhelming. These sensors agree with that, all shwing more instances of high muscle activity across sessions from 250s to 350s. Sublime face, yawning, and an explanation of how to read this graph below the cut.
Read the rest of this entry »
Felt emotion ratings to Stimulus 1
Posted: October 4, 2013 Filed under: Uncategorized | Tags: Average response, Continuous emotion ratings, Felt emotion, Repeated listenings, Sigur Ros, Stimulus 1 1 Comment
Continuous ratings of felt emotion, valence and arousal dimensions. The top graph shows the average rating against the related reports for felt emotional arousal, the second shows the ratings in heat values, each horizonal a single session’s response. The bottom pair are the same for the felt emotional valence ratings.
While arousal is very consistent across sessions, with perhaps an incremental intensification of response, valence shows striking variation in felt valence over the successive listenings. Though not a simple break, the later listenings show a greater proportion of time reporting felt negative valence. The intensity of valence seems similar, whether high or low, as visible in the symmetry around the Valence midpoint in the third plot.
