Felt emotion ratings to Stimulus 1
Posted: October 4, 2013 Filed under: Uncategorized | Tags: Average response, Continuous emotion ratings, Felt emotion, Repeated listenings, Sigur Ros, Stimulus 1 1 Comment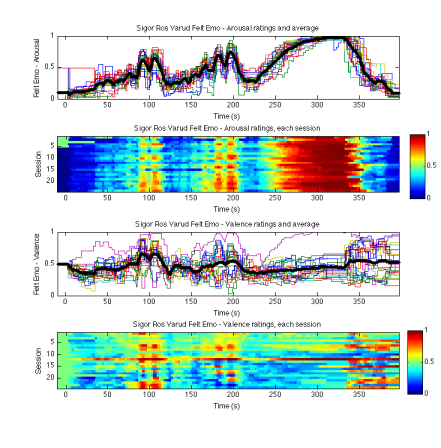
Continuous ratings of felt emotion, valence and arousal dimensions. The top graph shows the average rating against the related reports for felt emotional arousal, the second shows the ratings in heat values, each horizonal a single session’s response. The bottom pair are the same for the felt emotional valence ratings.
While arousal is very consistent across sessions, with perhaps an incremental intensification of response, valence shows striking variation in felt valence over the successive listenings. Though not a simple break, the later listenings show a greater proportion of time reporting felt negative valence. The intensity of valence seems similar, whether high or low, as visible in the symmetry around the Valence midpoint in the third plot.
