Stimulus 8: Feel Good Inc. by Gorillaz
Posted: November 13, 2017 Filed under: Cross-listening analysis, Stimulus-wise Analysis | Tags: Continuous emotion ratings, Feel Good Inc., Finger temperature, Gorillaz, Heartrate, Respiration rate, Skin conductance, Stimulus 8, surface Electromyography Leave a commentThese graphs report per stimulus the time course of responses across the 24 listening sessions. Some report the general patterns of responses, other show how the listener’s responses changed over successive exposures
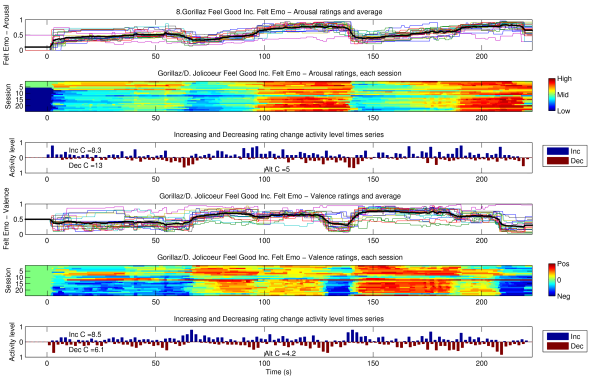
The continuous ratings of Felt Emotional Valence and Arousal, plotted three different ways. First as individual lines with the cross listening average, then layered per session with colour marking the scale values, and finally the activity-level times series reporting the proportion of listenings showing rating changes up or down per 2 s interval.
These responses were collected to Feel Good Inc., by Gorillaz, a song very familiar to the listener.
